Getting Started
This content has moved and will no longer be updated. Please go to https://docs.vmware.com/en/CloudHealth-Secure-State/ for the latest version. Please see the latest What's new for the more details about the move.
Last updated on February 24, 2022
General overview
This tutorial will show you how to get started with using CloudHealth Secure State (CHSS). CloudHealth Secure State is an intelligent multi-cloud security solution that helps organizations minimize security risk and proactively mitigate threats across cloud environments. The following steps will help you get started:
- Add an AWS, Azure, or GCP cloud account.
- View the dashboard and take actions on findings.
- Setup an email or a Slack integration and create an alert for real-time monitoring.
- Schedule a weekly summary email report.
If you prefer to onboard your accounts through the Secure State API, refer to the API Onboarding Guide.
Cloud account setup for AWS
AWS Overview
CloudHealth Secure State uses a read-only cloud account role to scan the AWS configurations to create an interconnected cloud security model of your environment. The service also uses a CloudWatch logs event stream of API calls from AWS to trigger near real-time notifications of configuration violations. For AWS accounts, the events are generated by setting up an event rule in the CloudWatch service. Secure State provides a shell script to simplify the setup of the CloudWatch event stream.
Before you set up an AWS cloud account:
- Know your cloud account Id.
- Confirm access to the cloud account’s AWS console.
- Have permissions to create an IAM role via AWS console.
- Have permissions to enable CloudWatch for your account.
- Ensure you have bash configured in your environment (run bash –version in a command line terminal). Secure State scripts for event stream setup work only for bash-supported environments.
Add AWS cloud account
-
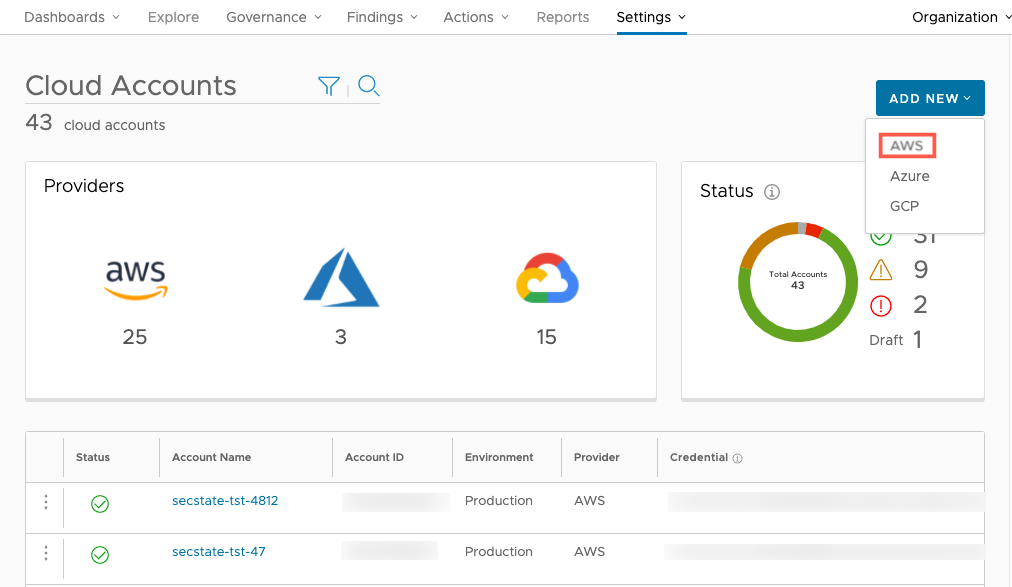
To connect a new AWS cloud account, navigate to Settings > Cloud accounts. Click the Add New button and select AWS. You can connect as many cloud accounts as required.
-
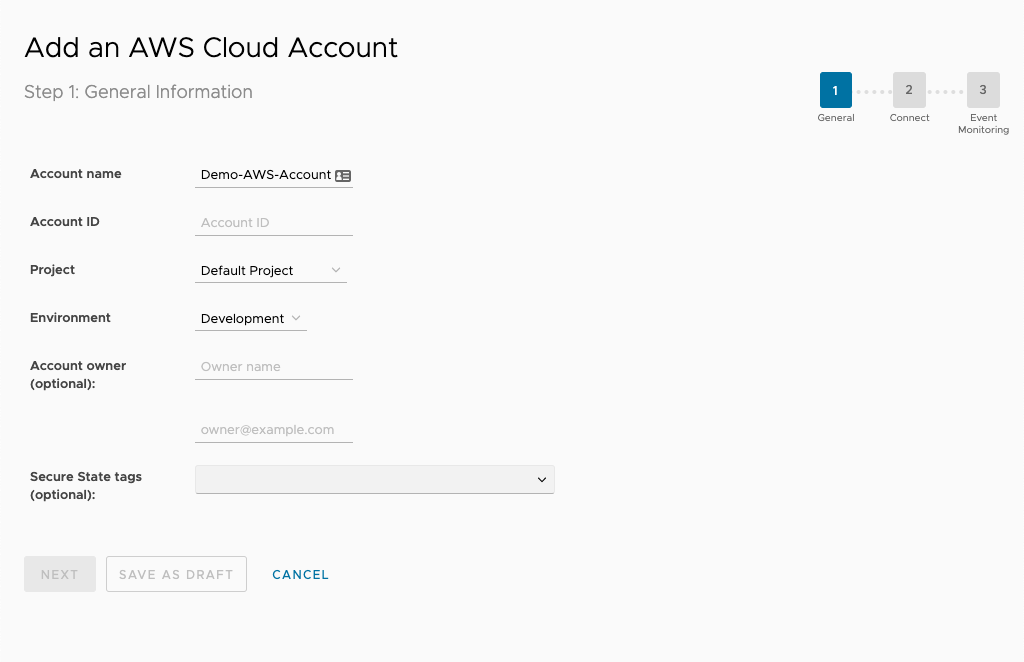
Next, enter the account name, provider, environment, and account owner. You can use these fields later to filter Secure State findings.


Connect AWS cloud account
CloudHealth Secure State requires a SecurityAudit Policy (granting read-only rights) for each AWS account you want to monitor. To streamline this process, you should be authenticated to the AWS console in the same browser that you used to log into the Secure State service.
-
From the AWS Management Console, select the IAM portal.
-
Select Roles in the sidebar.
-
Select Create role.
-
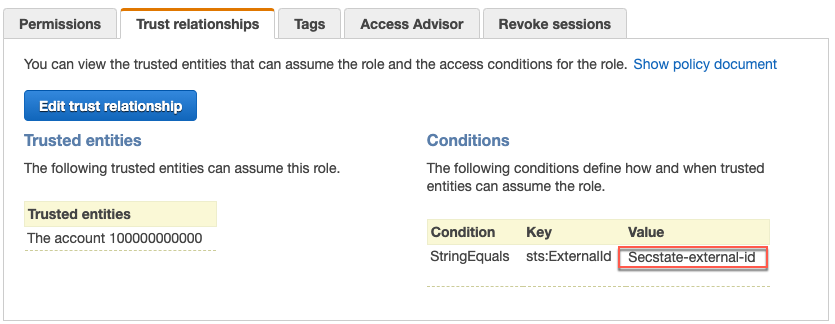
Make the following selections on to add the CloudHealth Secure State AWS account (910887748405) as a trusted entity.
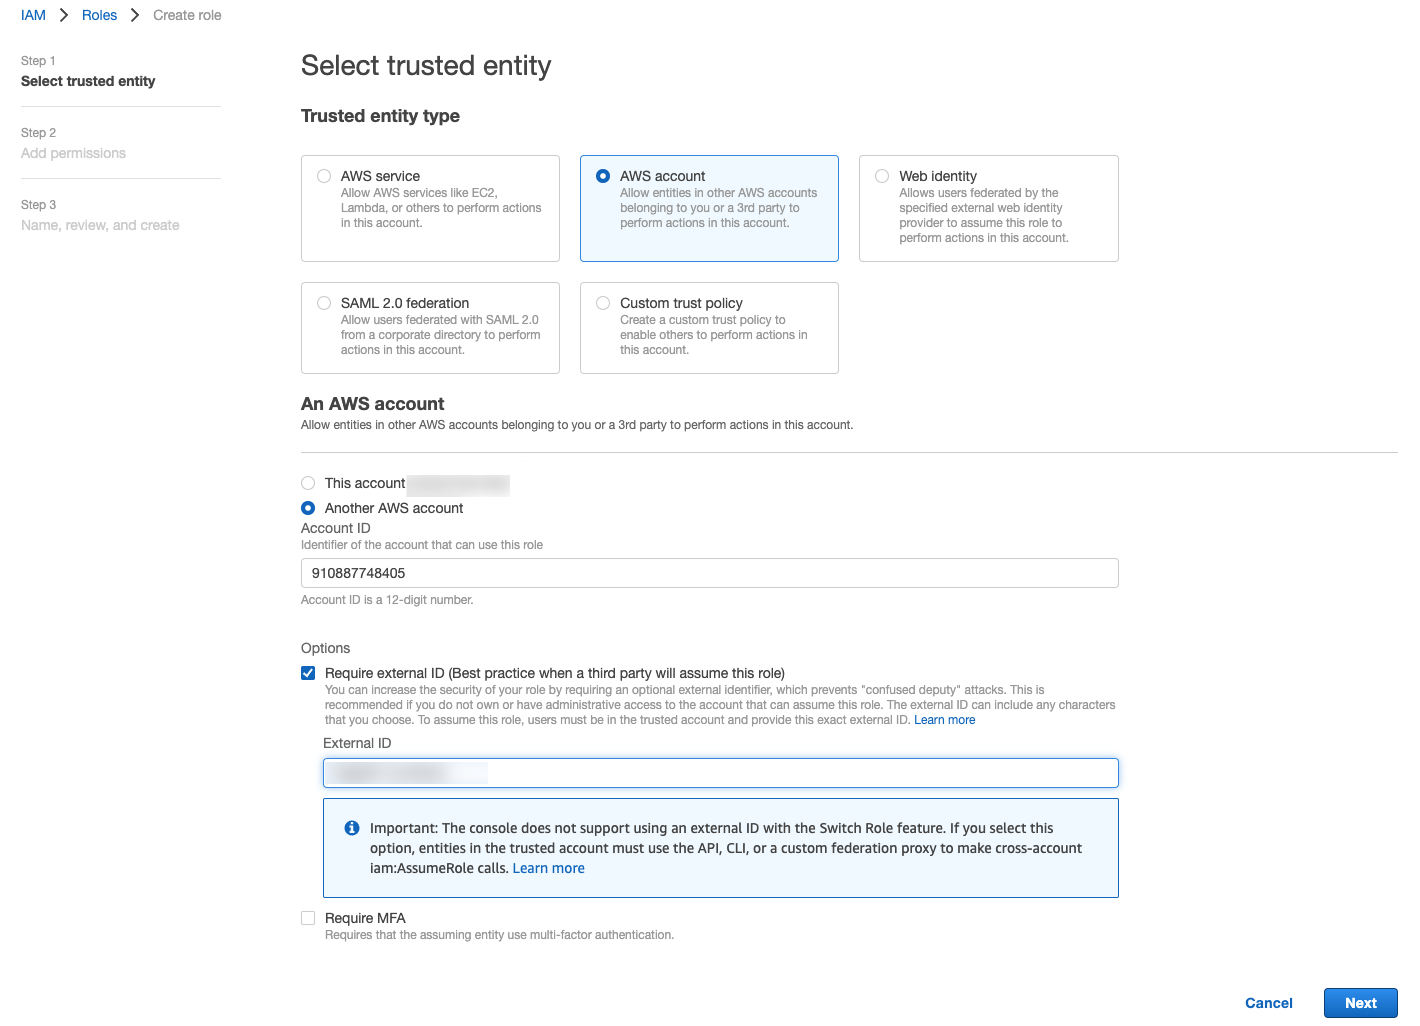
Note: For the External ID you may enter the string provided on the second page of the CloudHealth Secure State onboarding wizard or your own personal string.
-
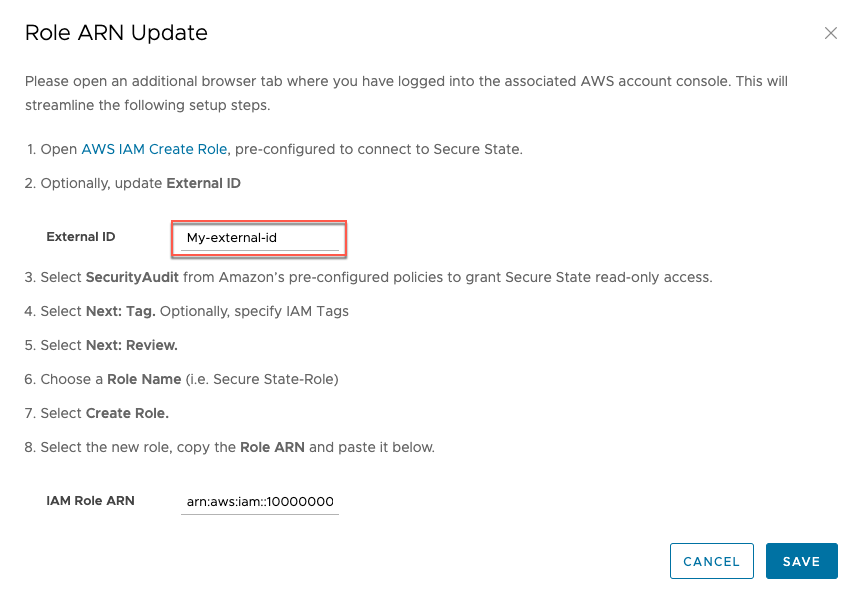
Select SecurityAudit from AWS's pre-configured policy list. This grants read-only access to your account.
-
Enter a name for the role, include any optional description or tags, then select Create role.
-
From the Roles page, locate your new role in the list and select it.
-
Copy the information under ARN. If you entered your own external ID, you can copy it from the Trust relationships tab if you didn't do so earlier.
-
Enter the ARN and External ID on the CloudHealth Secure State onboarding wizard where indicated. Ensure they match the same values you entered in step 4.
-
Choose whether or not to the enable pre-configured integrations for this account, then select Save.

With read-only access, Secure State can be configured to perform daily, weekly, or monthly scans. Secure State can operate with an indexing only mode if desired, but the setup process also guides you on how to set up an event stream. While not required, it is highly recommended that you set this up and enable real-time threat detection.
Troubleshooting for AWS
Review this section for various error messages you may receive when trying to connect your cloud account to Secure State.
InvalidRole error
If you receive an "InvalidRole" error while onboarding your AWS cloud account to Secure State, the result is likely a mismatch between the external ID you entered in Secure State and the one in your account's trust relationship on AWS.
To verify these two values, follow these steps:
-
In the Secure State UI, go to the cloud account information and click on Change.
-
Note down or copy the value in the external ID field.
-
Verify the external ID in AWS matches the one in Secure State. Update one or the other so that both values are the same.


Event stream setup script overview for AWS
Secure State uses event streams to provide real-time updates about security findings for your monitored cloud accounts. Configuring an event stream for your cloud account is necessary to get information about misconfigurations and other vulnerabilities immediately, otherwise your information is only as accurate as your most recent system scan.
The event stream can be set up with a shell script available from the Secure State portal. You can run the script in the AWS CloudShell or CLI.
The shell script performs several actions:
- Checks for an active CloudTrail in each region.
- Creates a CloudWatch event rule in each active CloudTrail region for AWS API actions.
- Creates a AWS Simple Notification Service (SNS) topic to receive the events.
- Subscribes a Secure State queue to the SNS topic.
The script must be run from a terminal where access to the target AWS account is available through an environment variable or by using the --profile option. After checking for a CloudTrail in each region, the script runs a CloudFormation template anywhere a CloudTrail is found. The CloudFormation template is referenced in the shell script and can be found at https://s3.amazonaws.com/cloudcoreo-files/devtime/devtime_cfn.yml
Event stream setup using AWS CloudShell
-
Before running the setup script, make sure CloudTrail is enabled on your cloud account.
-
From your cloud account, open AWS CloudShell and run this command:
curl https://app.securestate.vmware.com/downloads/setup-coreo-devtime.sh --output setup-coreo-devtime.sh && sh setup-coreo-devtime.sh
Event stream setup using AWS CLI
Before downloading the setup script, ensure these prerequisites are in place:
-
Set the following IAM managed policy for your user in the AWS console so you can export your access key and secret access ID. You may remove it after setup is complete.
{ "Version": "2012-10-17", "Statement": [ { "Effect": "Allow", "Action": [ "sns:*", "cloudtrail:*", "cloudformation:*", "events:*" ], "Resource": "*" } ] } -
Enable CloudTrail on your cloud account.
-
Install the AWS CLI.
-
Export your environment variables, specifically the access key and secret access key.
After confirming the prerequisites, enter this command to download and run the event stream setup shell script:
curl https://app.securestate.vmware.com/downloads/setup-coreo-devtime.sh --output setup-coreo-devtime.sh && sh setup-coreo-devtime.sh
Alternatively, you may invoke the script with the profile option:
sh ./setup-coreo-devtime.sh --profile profile_name
Event Stream Configuration and Resource Details
You can configure CloudWatch event rules manually or through some other deployment path. The following applies for individual accounts that are sending their own (or forwarded from a different account) CloudWatch events. A CloudWatch event rule is required in each region. The event source is built from this custom event pattern:
{
    "detail-type": [
    "AWS API Call via CloudTrail"
    ],
    "detail": {
        "eventSource": [
        "acm.amazonaws.com",
        "autoscaling.amazonaws.com",
        "cloudformation.amazonaws.com",
        "cloudfront.amazonaws.com",
        "cloudhsm.amazonaws.com",
        "cloudtrail.amazonaws.com",
        "directconnect.amazonaws.com",
        "dynamodb.amazonaws.com",
        "ec2.amazonaws.com",
        "elasticache.amazonaws.com",
        "elasticloadbalancing.amazonaws.com",
        "es.amazonaws.com",
        "iam.amazonaws.com",
        "kms.amazonaws.com",
        "rds.amazonaws.com",
        "redshift.amazonaws.com",
        "route53.amazonaws.com",
        "s3.amazonaws.com",
        "ses.amazonaws.com",
        "sqs.amazonaws.com",
        "waf.amazonaws.com"
        ]
    }
}
A target is added to the rule for events to invoke. Secure States uses an SNS topic as the target, with the input as the default matched event. The SNS topic name must be set to “cloudcoreo-events” when configuring the event stream. The topic has a subscription that uses Amazon SQS protocol. The SNS topic is created in every region, and all SNS topics have the same subscription endpoint:
arn:aws:sqs:us-west-2:910887748405:cloudcoreo-events-queue
Event stream removal for AWS
To remove the event stream, perform these steps:
- From the Secure State dashboard, navigate to Settings > Cloud accounts.
- Select your AWS cloud account.
- On the cloud account details page, select Turn-Off under event stream and follow the instructions.
Alternatively, you can use the vss event remove command in the AWS CLI, or remove the event stream manually through an existing deployment path.
Cloud account setup for Azure
Azure overview
Secure State uses a read-only cloud account role to scan the Azure configurations to create an interconnected cloud security model of your environment. The service also uses an activity log event stream from Azure to trigger near real-time notifications of configuration violations.
For Azure accounts, the events are generated by monitoring activity logs that trigger a Secure State webhook. Secure State provides a shell script which simplifies setup of stream of activity log events into our system.
Before you set up an Azure cloud account:
- Know your Azure Subscription Id.
- Confirm access to the cloud account’s Azure console.
- Have permissions to register a new Azure Active Directory app and create a new secret.
- Have permissions to enable a new activity log subscription for your account.
Add Azure cloud account
- To connect a new Azure cloud account, navigate to Settings > Cloud accounts.
- Click the Add New button and select Azure. You can connect as many cloud accounts as required.
- Enter the account name, account type (Commercial or Government), provider, environment, and account owner. You can use these fields later to filter Secure State findings.

Connect Azure cloud account
Secure State requires read privileges for your Azure subscription to begin monitoring. To set up read privileges, Secure State requires users to register an application in the Azure portal and provide:
- Application ID
- Tenant ID
- Application Key
- Subscription ID
To retrieve the above parameters:
-
Sign into the Azure portal and navigate to Azure Active Directory > App registrations > New registration.
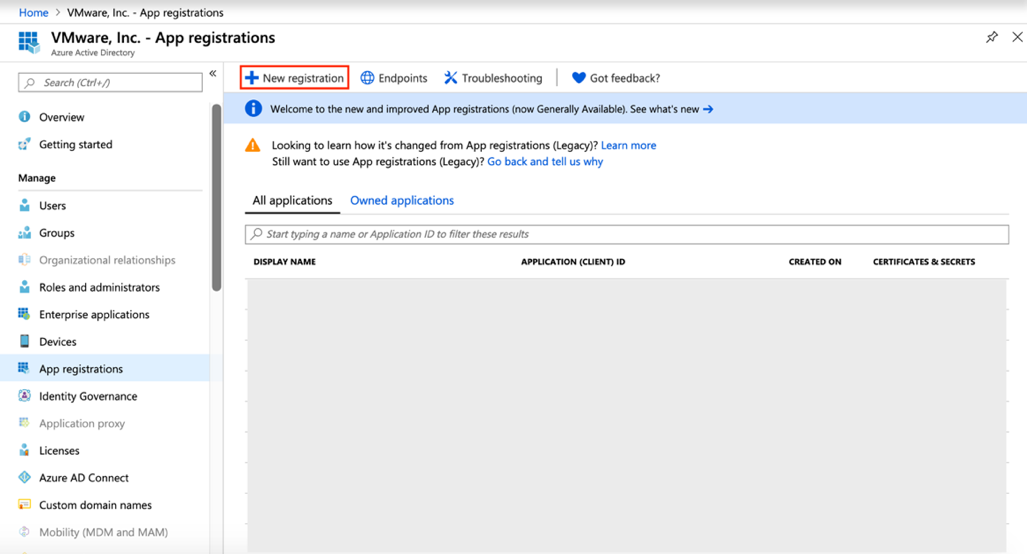
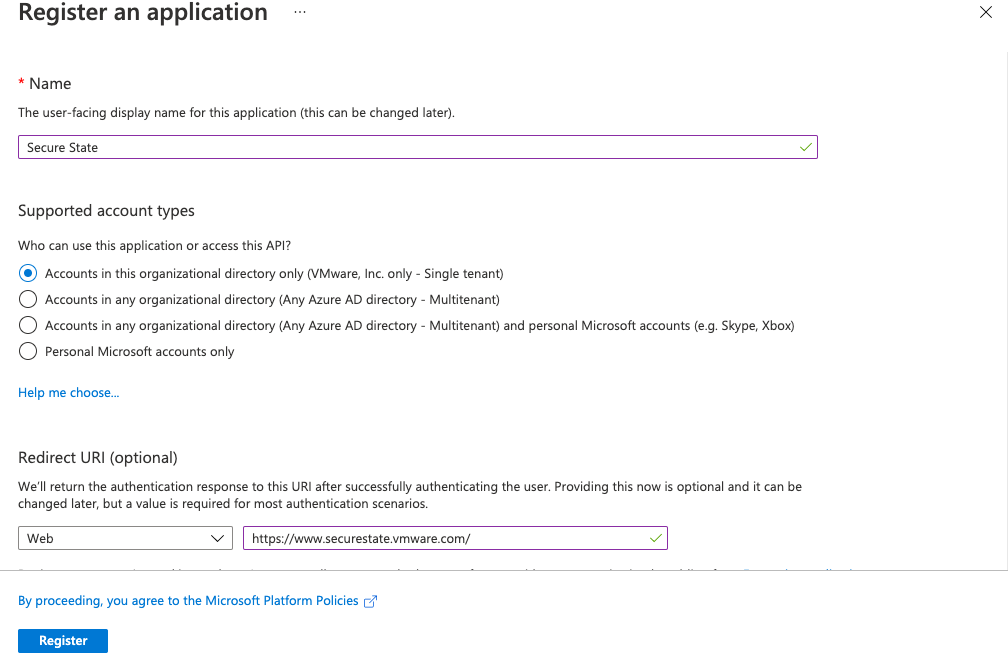
-
Complete the requested fields and click register.
-
To get the Application ID, navigate to Azure Active Directory > App Registrations (Preview).
-
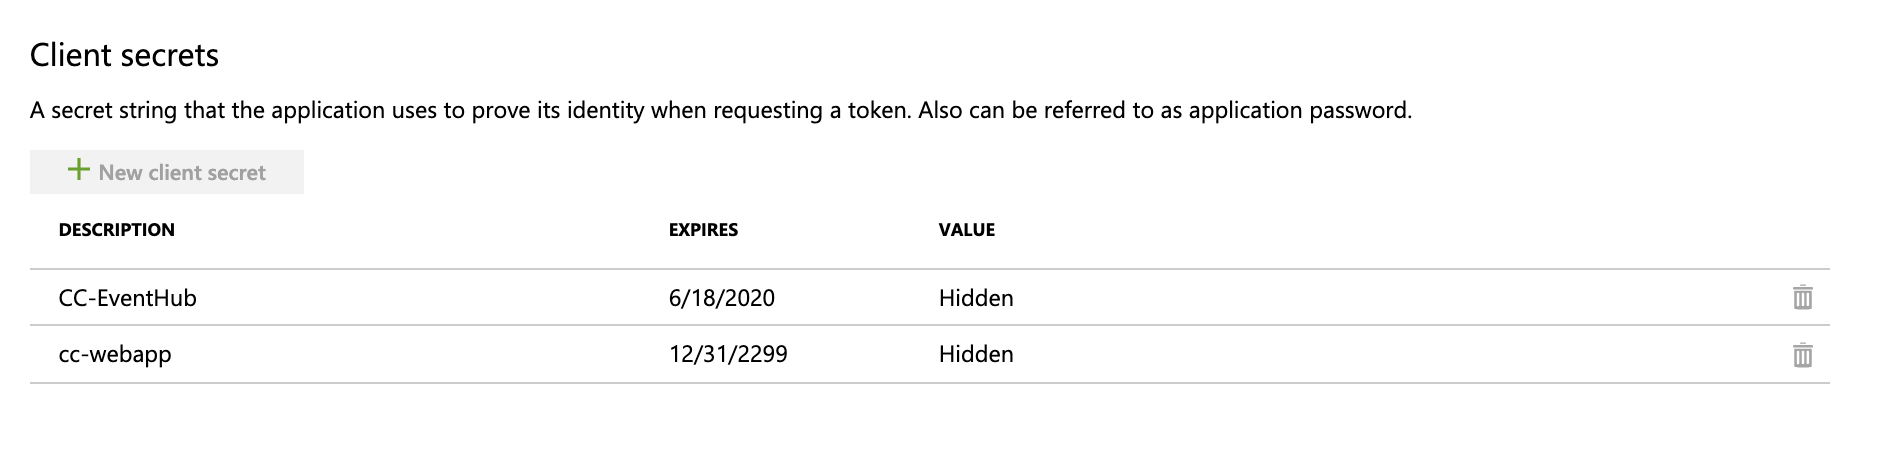
To retrieve an Application Key, navigate to Azure Active Directory > App Registrations > Secure State > Certificates & Secrets.
-
Click + New client secret, add a description and expiration time, then copy the value.
-
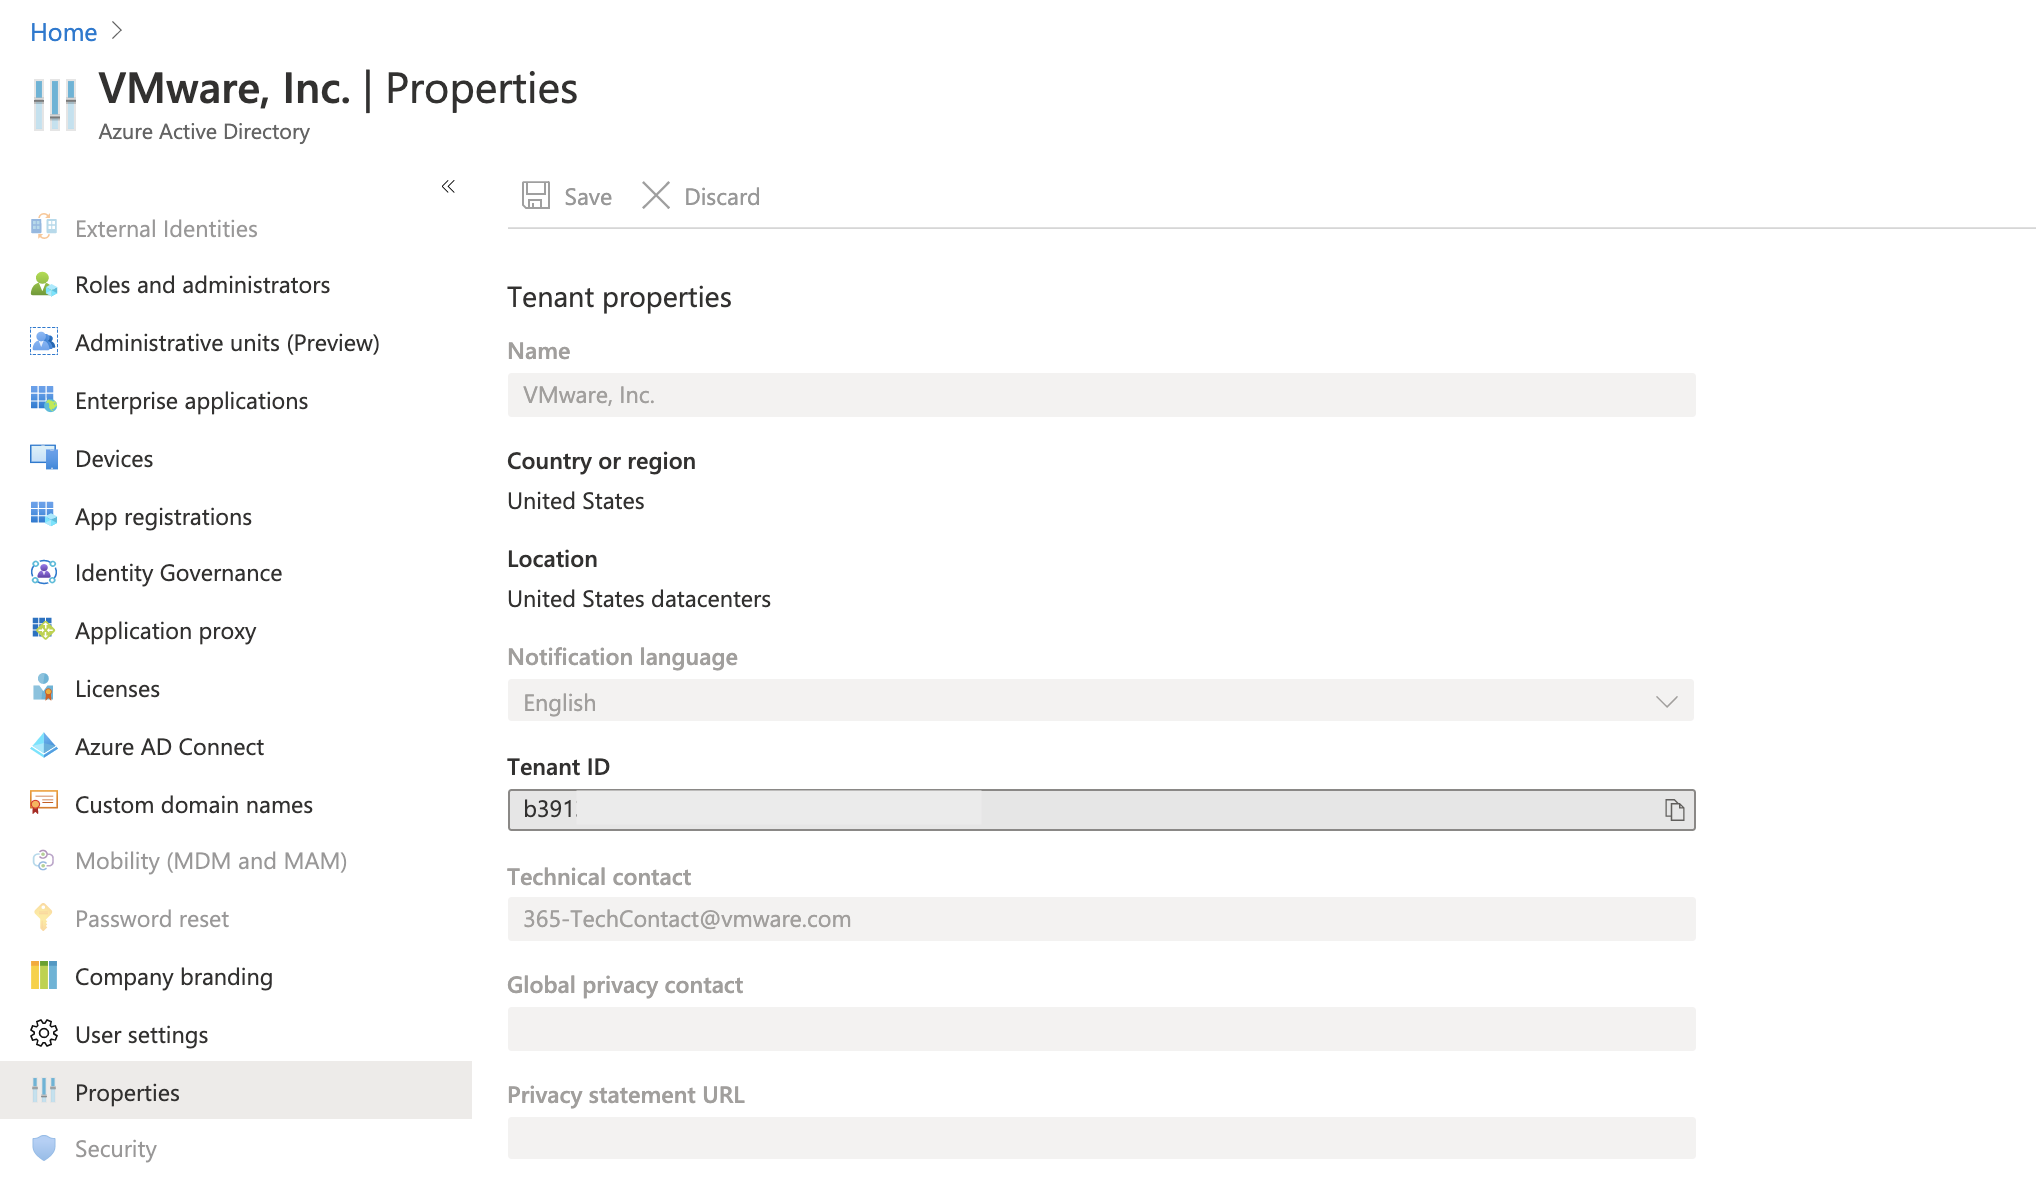
To retrieve the Tenant ID, navigate to Azure Active Directory > Properties and copy the Tenant ID value.
-
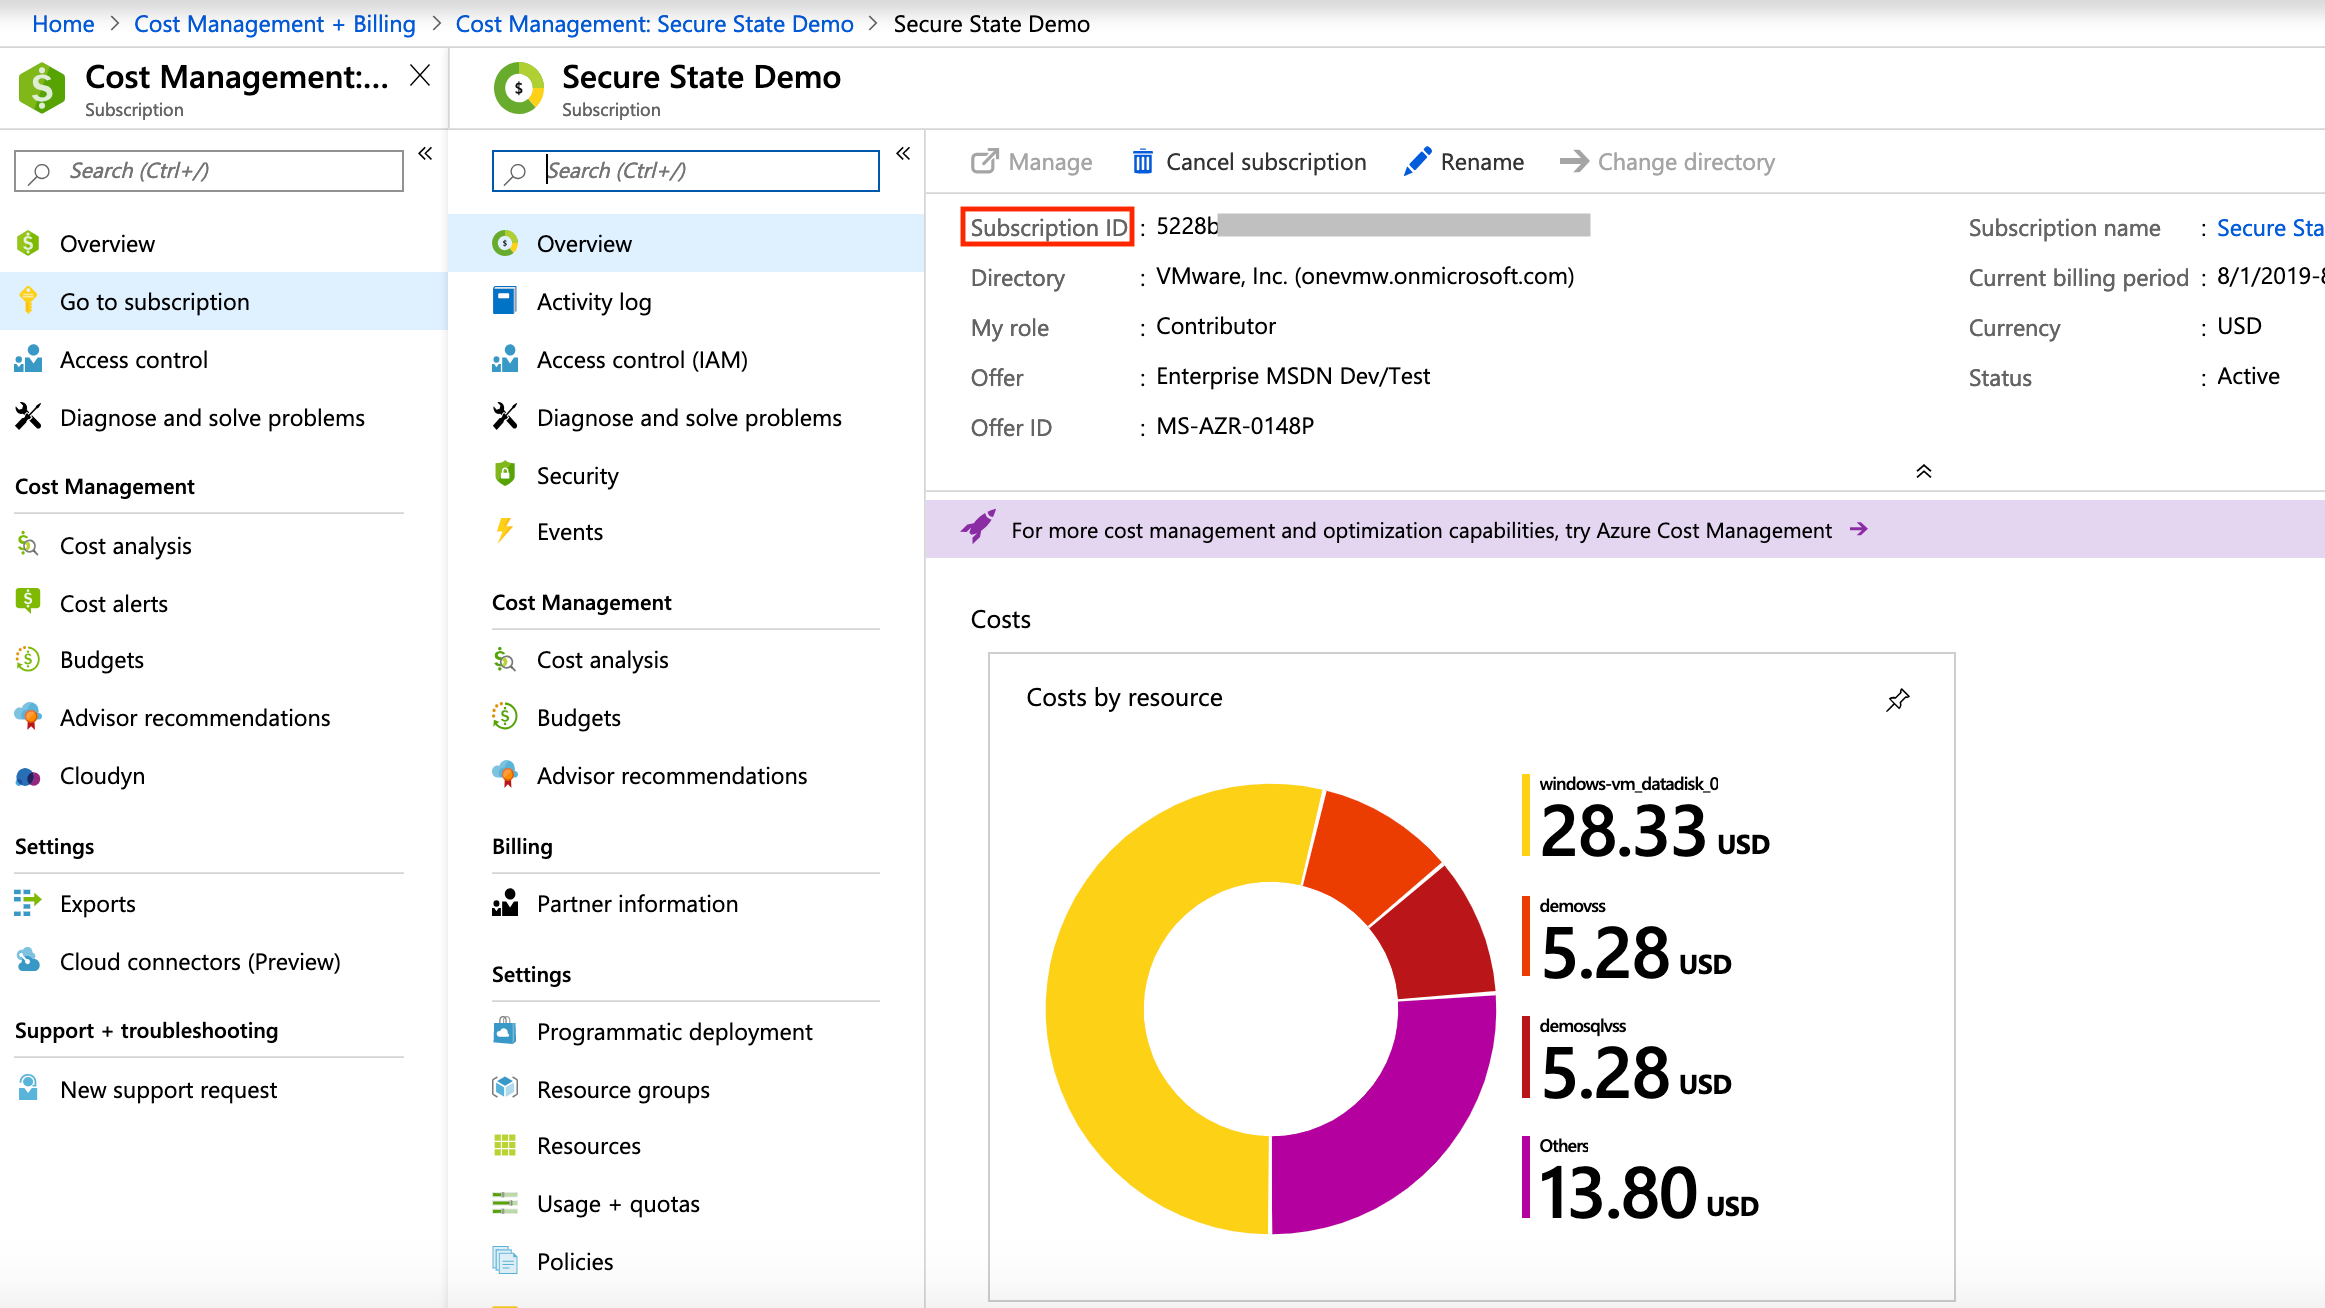
To retrieve the Subscription ID, navigate to Cost Management + Billing > Subscriptions. Copy the Subscription ID.


After you collect these four values, you can enter them when prompted by the Add an Azure Cloud Account wizard in the Secure State application.
Azure event stream setup overview
Secure State uses event streams through Azure Activity logs to provide real-time updates about security findings for your monitored cloud accounts. Configuring an event stream for your cloud account is necessary to get information about misconfigurations and other vulnerabilities immediately, otherwise your information is only as accurate as your most recent system scan.
Event stream setup using Azure shell script
The event stream is setup through a shell script you can download from the Secure State application and then run in the Azure Cloud Shell environment.
Open Azure Cloud Shell, then run this command:
curl https://app.securestate.vmware.com/downloads/setup-azure-coreo-devtime.sh --output setup-azure-coreo-devtime.sh && curl https://app.securestate.vmware.com/downloads/azure_webhook_alert.json --output azure_webhook_alert.json && curl https://app.securestate.vmware.com/downloads/azure_webhook_action.json --output azure_webhook_action.json && /bin/bash setup-azure-coreo-devtime.sh -s <Your_Subscription_ID> -a azure_webhook_action.json -f azure_webhook_alert.json -w https://r62g0jx9a9.execute-api.us-west-2.amazonaws.com/LATEST/
On successful execution of this command, the Azure subscription is configured to send activity log events to Secure State.
Remove event stream for Azure
To remove the event stream for an Azure subscription, perform these steps:
- From the Secure State dashboard, navigate to Settings > Cloud accounts.
- Select your Azure cloud account.
- On the cloud account details page, select Turn-Off under event stream and follow the instructions.
Cloud account setup for GCP
To connect a new GCP project, you must first create a service account for authentication. The service account is read-only, and the Secure State platform uses it to perform several key tasks:
- Scans your GCP resource configurations to create an interconnected cloud security model of the environment.
- Performs near real-time evaluations of configuration changes with the Google Cloud Logging API connected to a Pub/Sub as the event stream.
Secure State provides shell scripts throughout this guide to simplify the creation of the Service Account and set up the event stream with Google Deployment Manager. Although you can use the Google Cloud SDK in a local shell to run the scripts, using Google Cloud Shell for the setup process offers a more streamlined experience with less dependencies.
Enable GCP APIs
You must enable several APIs in GCP so Secure State can call them to inventory your cloud environment. These instructions assume you are using the Google Cloud Shell to enable the APIs, but you can also enable them individually the GCP Cloud SDK.
- Enable the GCP APIs for service monitoring:
gcloud services enable appengine.googleapis.com bigquery.googleapis.com bigtable.googleapis.com cloudapis.googleapis.com cloudasset.googleapis.com cloudfunctions.googleapis.com dataflow.googleapis.com dns.googleapis.com dataproc.googleapis.com cloudresourcemanager.googleapis.com cloudkms.googleapis.com sqladmin.googleapis.com compute.googleapis.com storage-component.googleapis.com recommender.googleapis.com iam.googleapis.com container.googleapis.com monitoring.googleapis.com logging.googleapis.com containerthreatdetection.googleapis.com
- Enable Deployment Manager and Pub/Sub APIs to setup event stream after you’ve onboarded your projects.
gcloud services enable deploymentmanager.googleapis.com pubsub.googleapis.com
You can verify that these services are active in your GCP console’s APIs & Services dashboard.
Enable GCP APIs for bulk onboarding
If you have multiple projects under a single organization, you can also enable Google Cloud APIs at the organization-level by using these commands in the GCP console or Google Cloud Shell:
-
Enable service monitoring GCP APIs for all projects in your organization:
for project in $(gcloud projects list --format="value(projectId)"); do echo "ProjectId: $project"; gcloud config set project $project; gcloud services enable appengine.googleapis.com bigquery.googleapis.com bigtable.googleapis.com cloudapis.googleapis.com cloudasset.googleapis.com cloudfunctions.googleapis.com dataflow.googleapis.com dns.googleapis.com dataproc.googleapis.com cloudresourcemanager.googleapis.com cloudkms.googleapis.com sqladmin.googleapis.com compute.googleapis.com storage-component.googleapis.com recommender.googleapis.com iam.googleapis.com container.googleapis.com monitoring.googleapis.com logging.googleapis.com containerthreatdetection.googleapis.com; done; -
Enable event stream APIs for all projects in your organization:
for project in $(gcloud projects list --format="value(projectId)");
    do echo "ProjectId: $project";
    gcloud config set project $project;
    gcloud services enable deploymentmanager.googleapis.com pubsub.googleapis.com;
done;
Set up an organization-level service account
An organization-level service account allows you to onboard multiple GCP projects in bulk, provided you have the organization ID to create the service account. If you don’t have access to your organization ID, follow the Project-level Service Account instructions in the next section.
-
Retrieve your organization ID from the GCP console.
-
Ensure that the default service account (identified as <project-number>@cloudservices.gserviceaccount.com) has an IAM member with the Organization Administrator role. To create an IAM binding for the default service account, you can use the command below.
gcloud organizations add-iam-policy-binding <gcp_organization_id> --member serviceAccount:<gcp_project_number>@cloudservices.gserviceaccount.com --role roles/resourcemanager.organizationAdmin
Use organization-level service accounts where possible so you can onboard and manage multiple GCP projects in bulk and set up event streams per project. The overall architecture for GCP monitoring appears below. And the following sections provide detailed steps for protecting your Google Cloud resources.

Set up a project-level service account
To set up a service account on a per-project basis, follow these steps.
Note: You must onboard every GCP project individually with these instructions, and you’ll need to have Project Owner & Project IAM Admin permissions.
-
Set the project ID you want to onboard to Secure State.
gcloud config set project <gcp_project_id> -
Create the custom role required by Secure State in the project.
gcloud iam roles create vmwareSecureStateRole --project=<gcp_project_id> --title="VMware Secure State Viewer" --description="Custom role including additional read permissions required for Secure state." --permissions=storage.buckets.get --stage=GA -
Create a service account in the project.
gcloud iam service-accounts create vmware-secure-state-account --project=<project_id> -
Create IAM members for the service account at the project scope.
gcloud projects add-iam-policy-binding <gcp_project_id> --member serviceAccount:vmware-secure-state-account@<gcp_project_id>.iam.gserviceaccount.com --role projects/<gcp_project_id>/roles/vmwareSecureStateRole gcloud projects add-iam-policy-binding <project_id> --member serviceAccount:vmware-secure-state-account@<gcp_project_id>.iam.gserviceaccount.com --role roles/viewer gcloud projects add-iam-policy-binding <gcp_project_id> --member serviceAccount:vmware-secure-state-account@<gcp_project_id>.iam.gserviceaccount.com --role roles/iam.securityReviewer -
Create the service account key file.
gcloud iam service-accounts keys create --iam-account vmware-secure-state-account@<gcp_project_id>.iam.gserviceaccount.com vmw-secure-state-sa-key.jsonNote: If you’re using Google CloudShell, use this command to download the service account key file.
cloudshell download vmw-secure-state-sa-key.json
Onboard service account
This section covers UI-based onboarding, but if you prefer to onboard your service account and GCP projects by using the API, refer to the API Onboarding Guide.
-
To connect a new GCP cloud account, navigate to Settings > Cloud accounts. Click the Add New button and select GCP. You can connect multiple GCP projects at the same time.
-
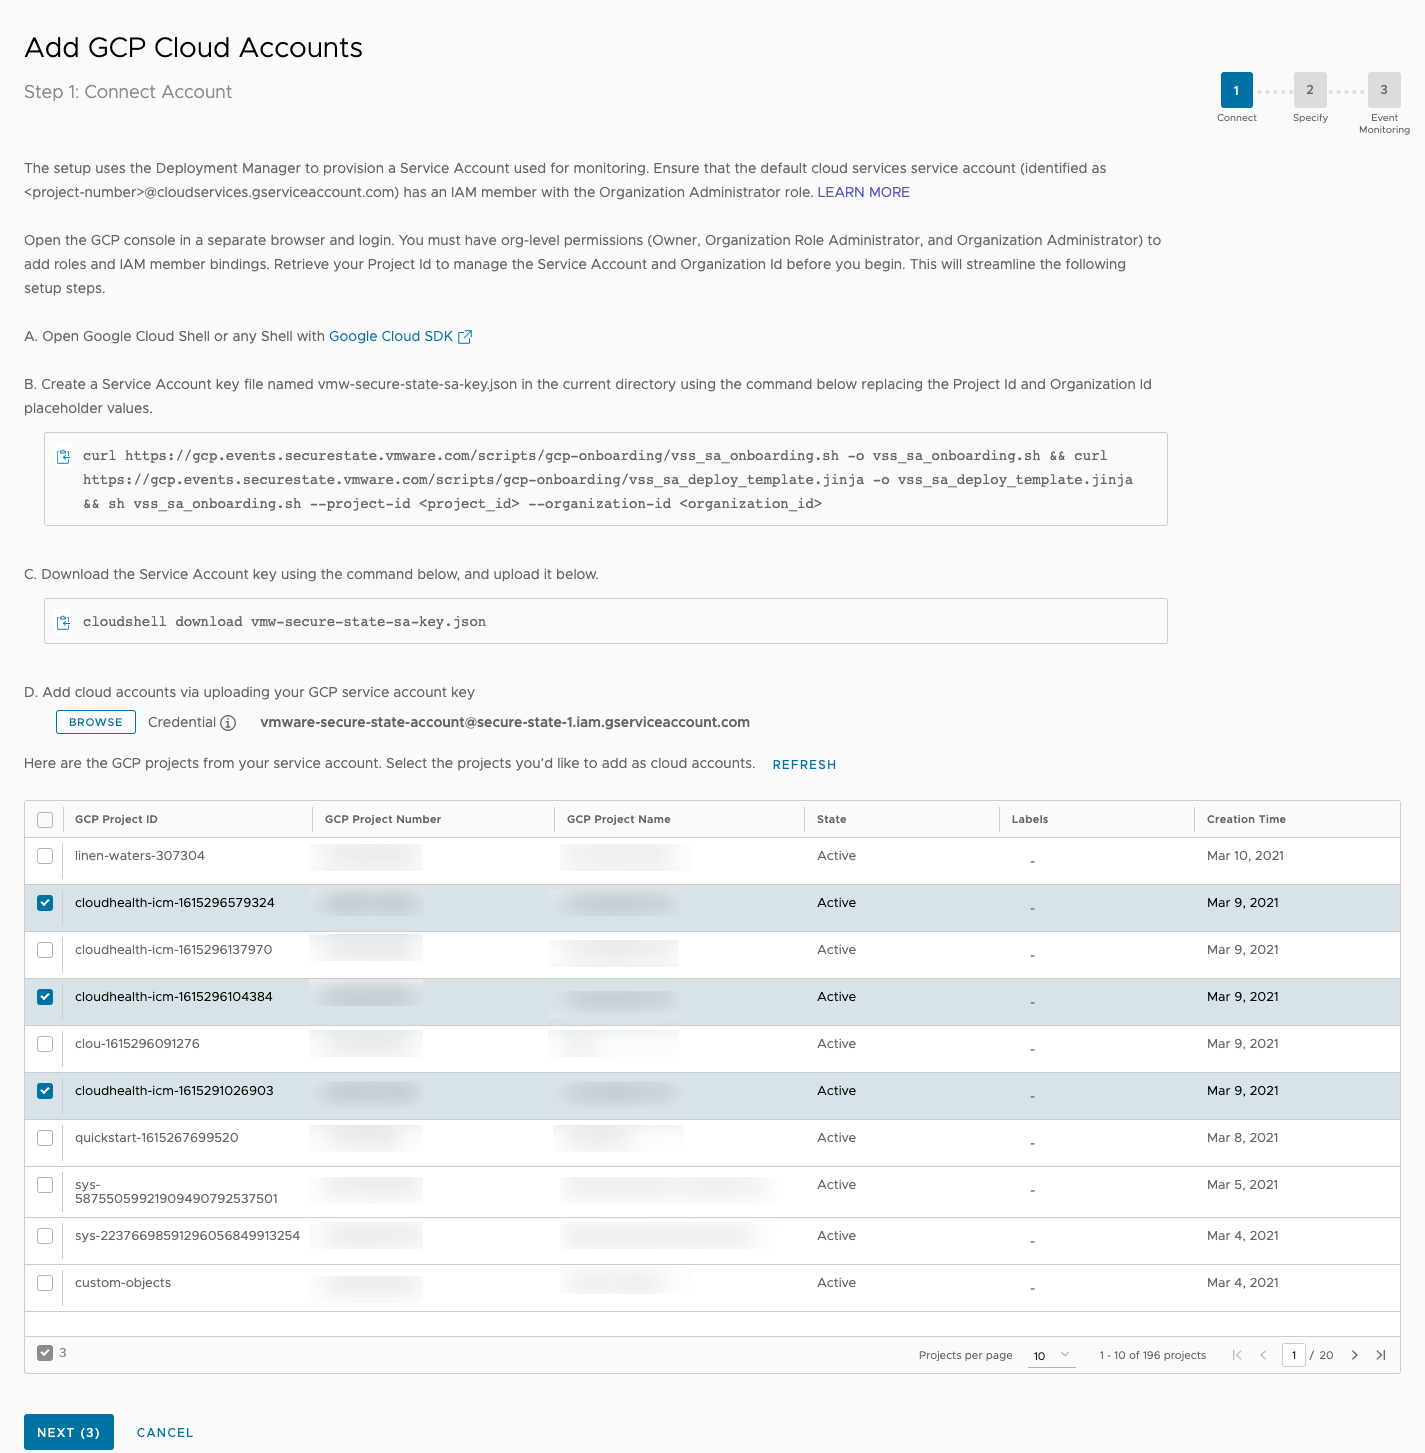
If you followed instructions to set up an organization-level service account, use the UI directions to get the service account onboarded and download the corresponding service account key. The UI onboarding script will create a aervice account at the organization level and assign it several read-only roles:
- Project Viewer to view configurations of the different services.
- Organization Viewer to list your GCP Organization metadata and policies.
- Folder Viewer to list your GCP folders.
- Security Reviewer to list your GCP Projects.
- VMware Secure State Role which is a custom role to get configuration details of a bucket.
Note: If you set up a project-level service account, you already assigned these roles in the previous section. From here, the onboarding actions will be the same regardless of whether you’re using an organization or project-level service account.
-
Upload the service account key file to Secure State. All GCP Projects that are accessible through the service account are listed. If you don’t see certain GCP Projects, make sure the service account permissions are configured to access them. Select the GCP projects to onboard.
-
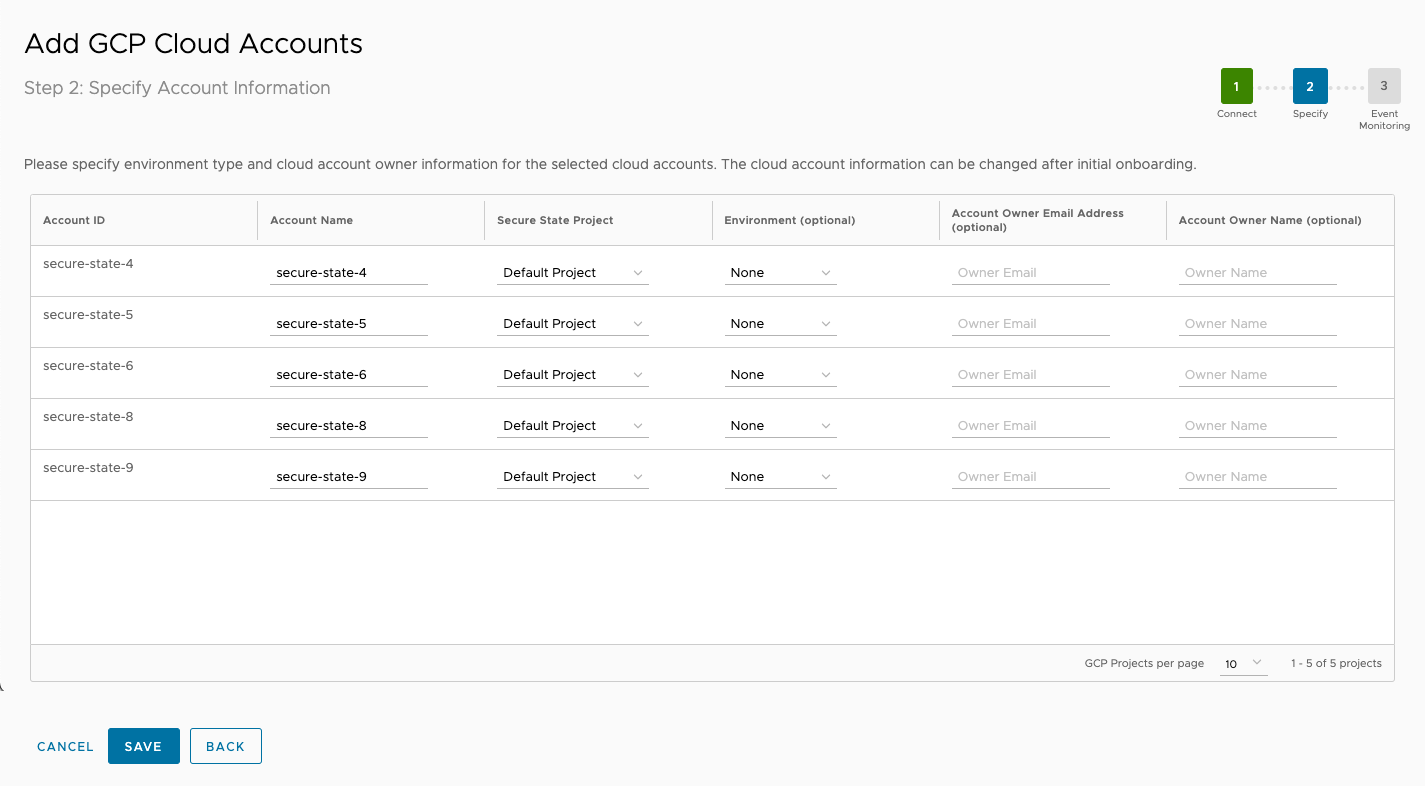
On the next screen, enter information in the Account Name, Secure State Project, Environment (optional), Account Owner Email Address, and Account Owner Name fields as you onboard the selected accounts.
-
Save your configurations and continue to set up your event stream.


GCP event stream overview
After you configure the GCP projects to monitor, you should set up an event stream for each project. Secure State uses event streams to provide real-time updates about security findings for your monitored cloud accounts. Configuring an event stream for your cloud account is necessary to get information about misconfigurations and other vulnerabilities immediately, otherwise your information is only as accurate as your most recent system scan.

Event stream setup for GCP
Secure State provides a simple script and a ready-to-use command in the UI for this setup. You can run this command from Google Cloud Shell or on a local terminal if you've installed the Google Cloud SDK.
curl https://gcp.events.securestate.vmware.com/scripts/gcp-eventstream/setup-securestate-events.sh -o setup-securestate-events.sh && curl https://gcp.events.securestate.vmware.com/scripts/gcp-eventstream/gcp-event-bridge.jinja -o gcp-event-bridge.jinja && sh setup-securestate-events.sh --endpoint=https://gcp.events.securestate.vmware.com --project-ids=<gcp_project_id1,gcp_project_id2,gcp_project_id3>
A Cloud Logging Sink and Pub/Sub is created per project selected to send change configurations to Secure State.
Note: While not recommended, a central event stream can also be setup for change monitoring across multiple projects. An Aggregator Sink must be configured to aggregate and send all log entries to Secure State.
After you run the script, click Finish. The GCP projects selected are onboarded for monitoring in Secure State.
Remove event stream for GCP
You can remove the event stream for an individual GCP account or a group of accounts using a simple script. To remove the event stream, follow these steps:
- From the Secure State dashboard, navigate to Settings > Cloud accounts.
- Select your GCP cloud account.
- On the cloud account details page, select Turn-Off under event stream and follow the instructions.
The script will remove the Cloud Logging, Pub/Sub topic and other pieces for the selected GCP projects.
Manage GCP cloud accounts
To onboard additional GCP projects in your environment after the initial setup, go to the details page for one of your GCP cloud accounts and select Manage.

This initiates the cloud account management workflow for your GCP credentials (that is, your service account). You can onboard new GCP Projects or remove existing ones connected to the service account from here.

To onboard new GCP projects, select the projects to onboard from the table at the bottom of the screen and click on Add Account. You’ll then be able to optionally provide Environment, Account Owner Name, and Account Owner Email Address related details, and to configure the event stream. Refer to the GCP event stream overview section for more information on event streams.
Remove cloud accounts
You can either remove GCP projects in bulk by going through the same work workflow for adding cloud accounts that share the same credential (service account) or do the removal on a per-account basis.
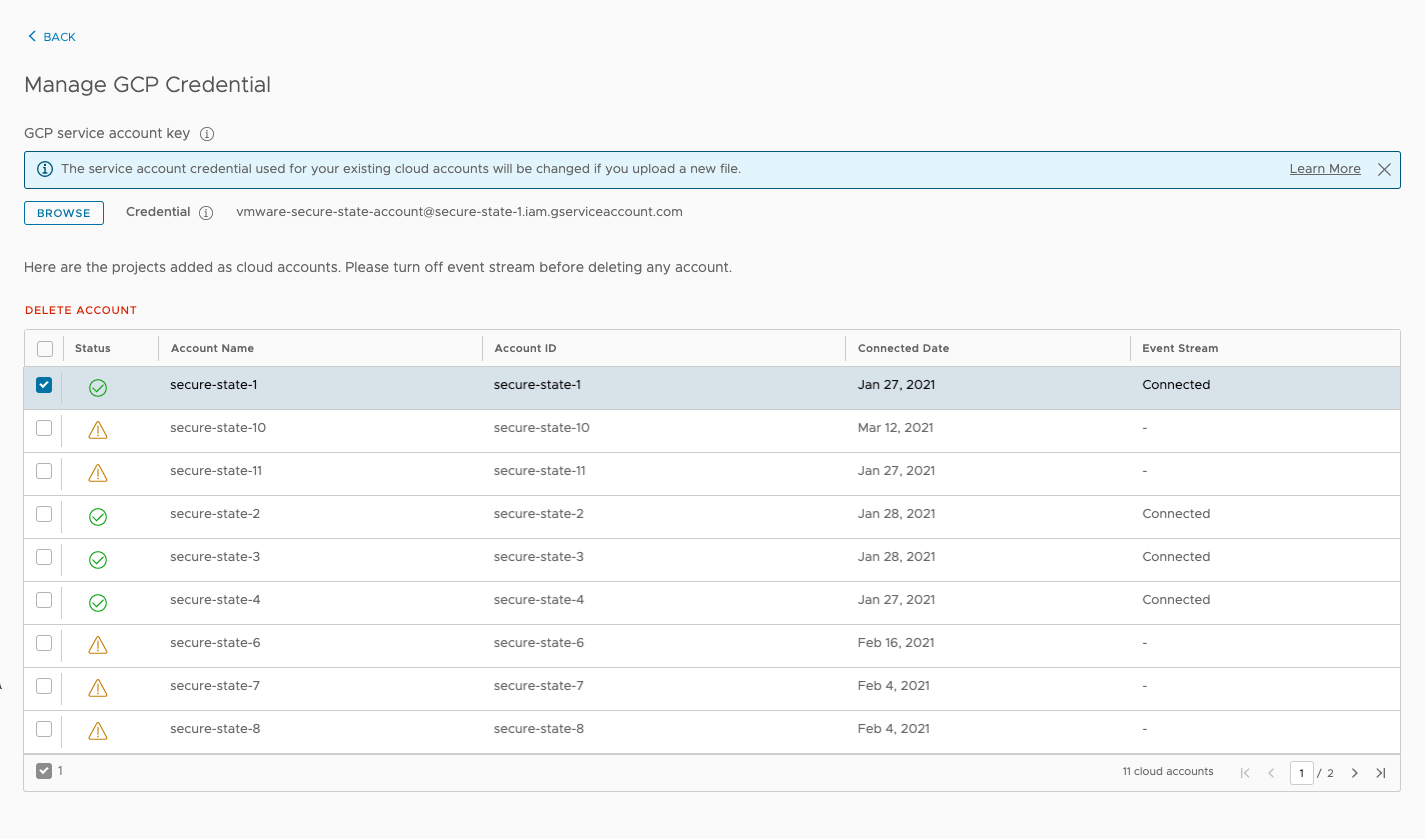
For bulk GCP account removal, begin by selecting Manage on one of the accounts. From the list of onboarded accounts, select the ones to remove and click Delete Account. A confirmation box will be presented for you to verify that only the desired cloud accounts have been selected for removal.
Next, click Delete, and the selected GCP account will be removed from Secure State monitoring. This action is not reversible and will lead to the removal of all findings, reports, remediations, and so on for the removed cloud accounts.
To remove a single GCP cloud account, navigate to the cloud account details page, click the Actions button, and select Delete. A confirmation dialog will be presented to verify whether this is intended. Select Delete and the cloud account will be removed from Secure State along with its findings, reports, remediations, and so on.
Note: You must remove the cloud account’s event stream before the cloud account can be removed from Secure State monitoring.
View Secure State dashboard and findings
Once you’ve added cloud accounts to your organization, you can start understanding the security vulnerabilities in your cloud environment and improving your security posture. The dashboard is a good starting point for receiving an overview of the configuration gaps detected.
View the dashboard
The dashboard provides a top-down view of the connected threats in the environment by severity, cloud accounts, services, regions, and so on, along with details on the percentage of violating rules and conformity with compliance frameworks.
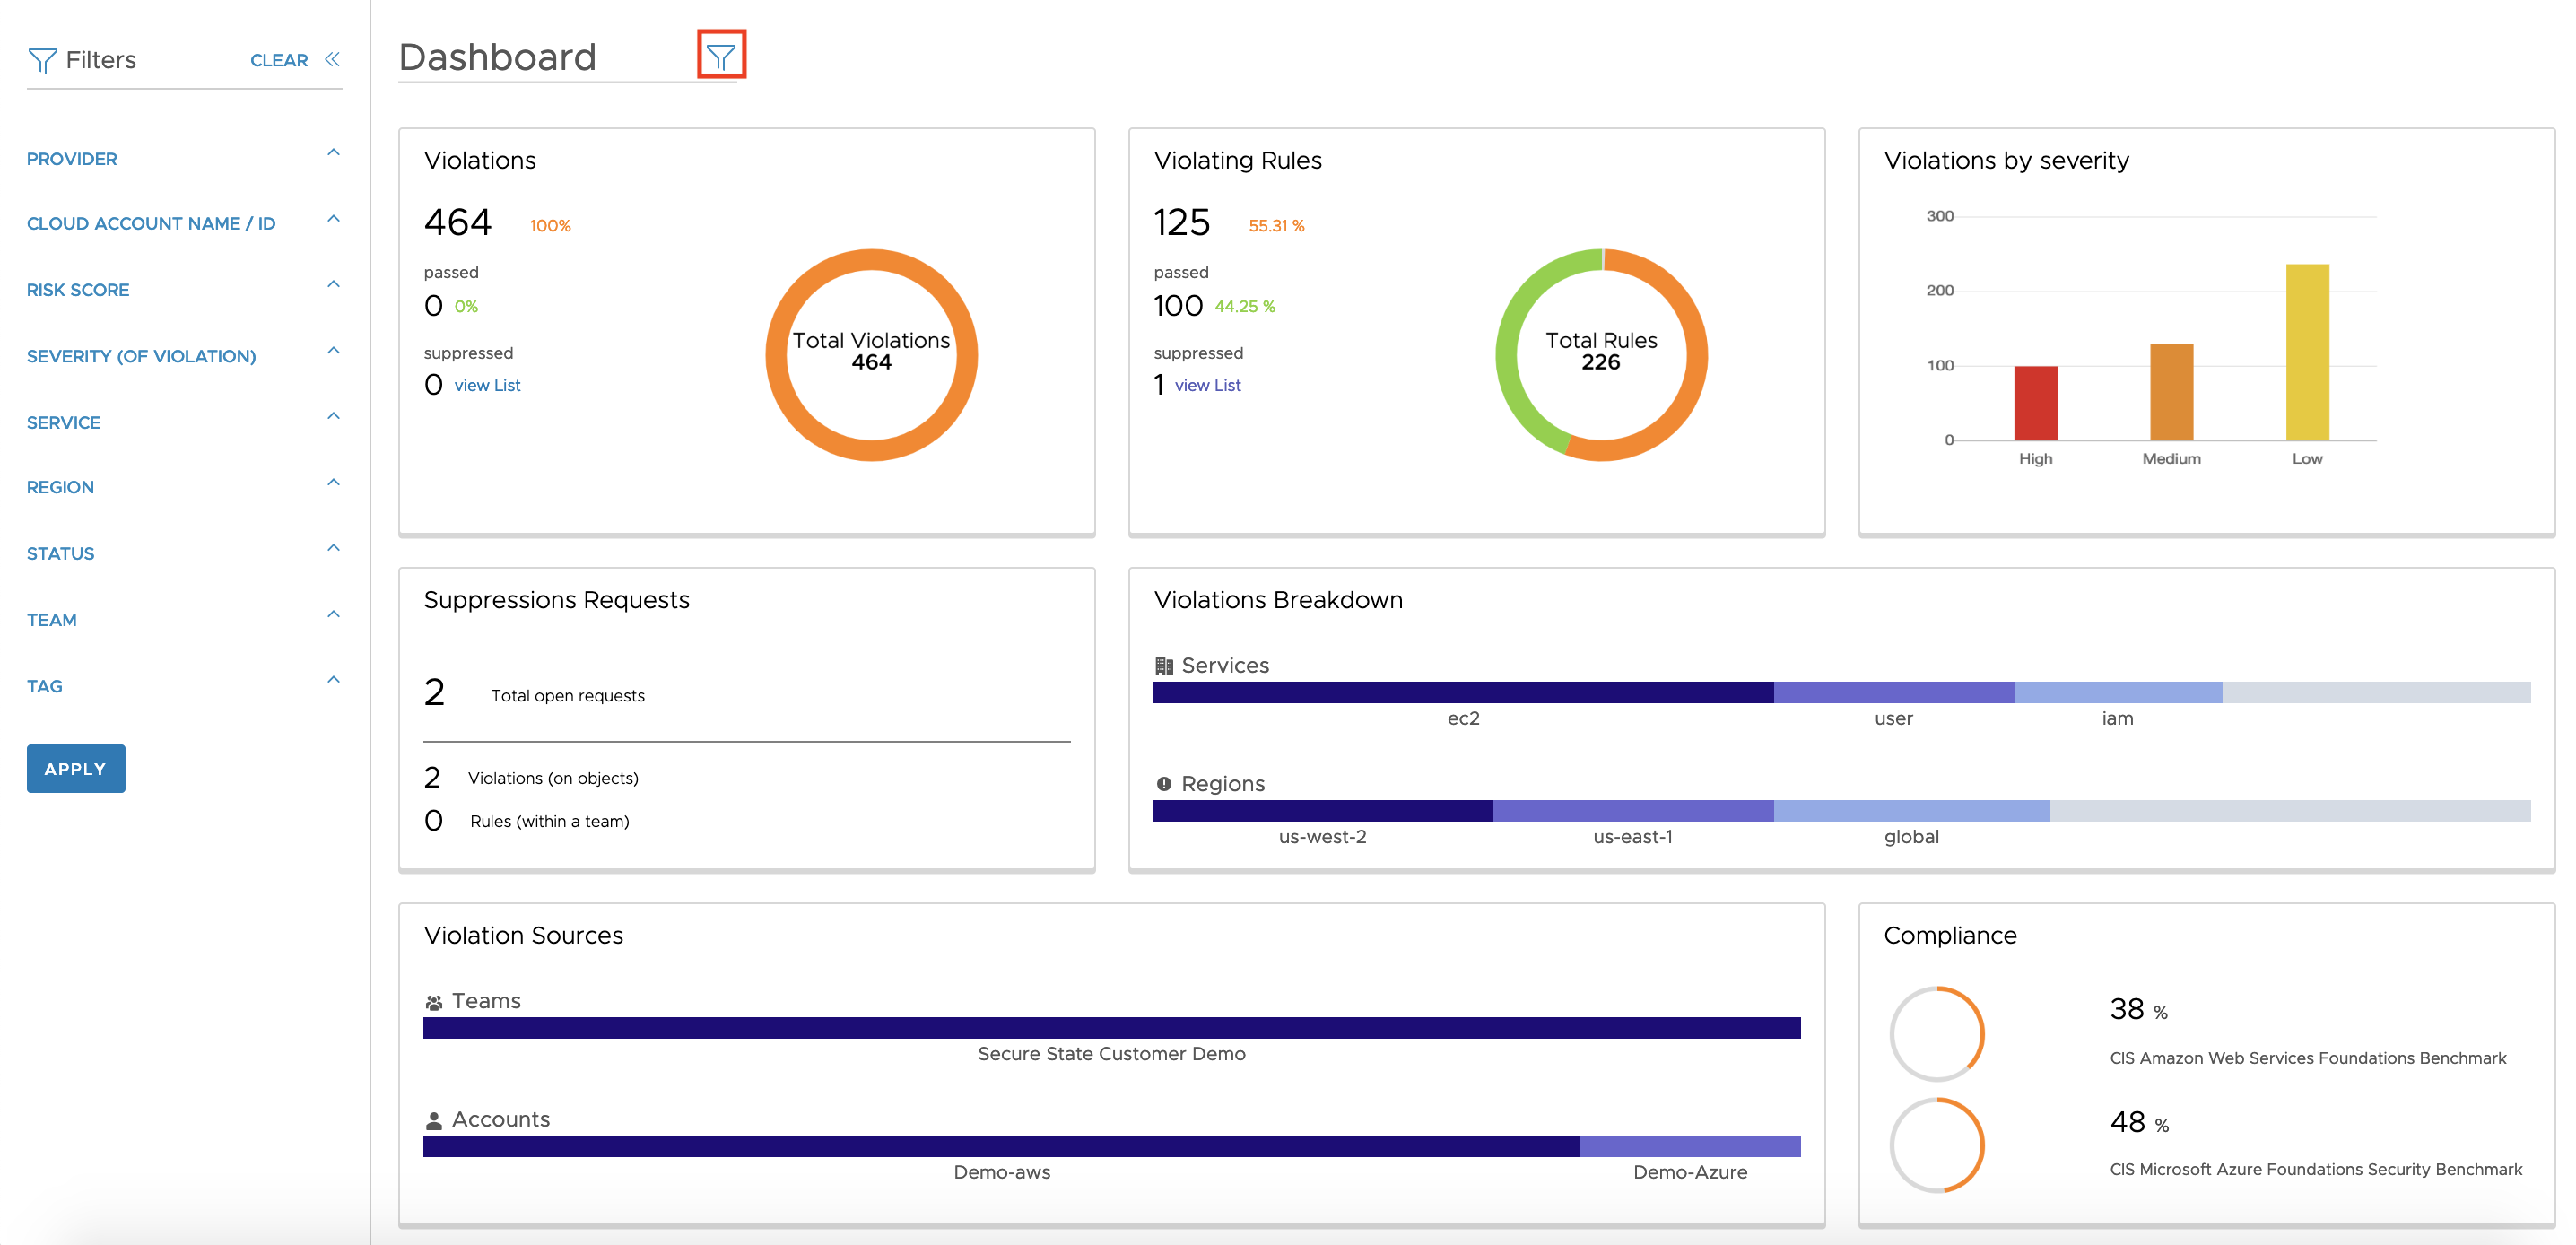
Filters can be applied to this view by clicking the funnel icon at the top or by selecting a particular dashboard element.
View findings
You can view all the findings generated by the Secure State’s connected threat model either by the cloud resource object, rule, or violation.
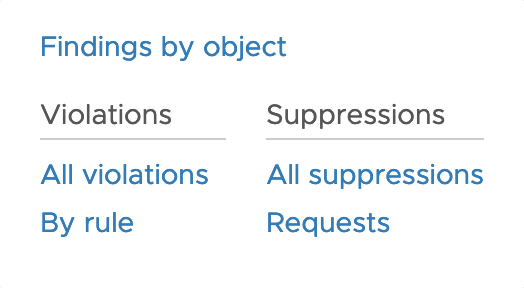
By going through the list of violations, security teams can get information on the violating object, its risk score, cloud service details, violation status, and so on to investigate and patch security gaps in their system.

Create a custom dashboard
CloudHealth Secure State has a single default dashboard available when you first onboard cloud accounts, but you can add as many additional dashboards as you need.
-
Click the Select Dashboards drop-down menu, then select Manage dashboard.
-
On the next screen, select Add Dashboard.
-
Enter a name for your dashboard, and choose the context if available (organization, or a an individual project you have access to).
-
Select a template for your dashboard. Three template types are available:
- Overview - The default template option, provides a high-level snapshot of your cloud security posture with metrics on findings, onboarded cloud accounts, suppression, compliance, and other top features.
- Trends - A template that displays data visualization for several findings metrics over time. You can view findings data over weekly, monthly, and biannual intervals.
- Compliance - This template provides a breakdown of your total compliance to all native and any custom frameworks.
-
Click Add.
Save dashboard filters
Follow these directions to permanently save filters to a selected dashboard. This feature is currently in private beta, reach out to your CloudHealth Secure State representative if you're interested in participating.
-
Click the Select Dashboards drop-down menu, then select Manage dashboard.
-
On the next screen, select the checkbox next to the dashboard you want to edit, then click Edit Dashboard.
-
Apply the filters you want to use, then click Save. You can review the Findings Guide for a list of each filter choice.
You can use this feature to create multiple versions of a dashboard that you can easily switch between, such as separate overview dashboards filtered for specific cloud providers.
Configure real-time notifications
Secure State natively integrates with email, Slack, Splunk, and other common engineering and ops tools to inform users about the live state of their cloud security. Alerts can be configured to notify users depending on the type of vulnerability detected.
Slack integration setup
To setup a Slack integration, first go to** Settings > Integrations -> Add Integration -> Slack**. Give your Slack integration a name and select “Get Auth Code.”

Next, accept the permissions to setup the SecureState-AlertBot with Slack.

Setup Slack or email alert
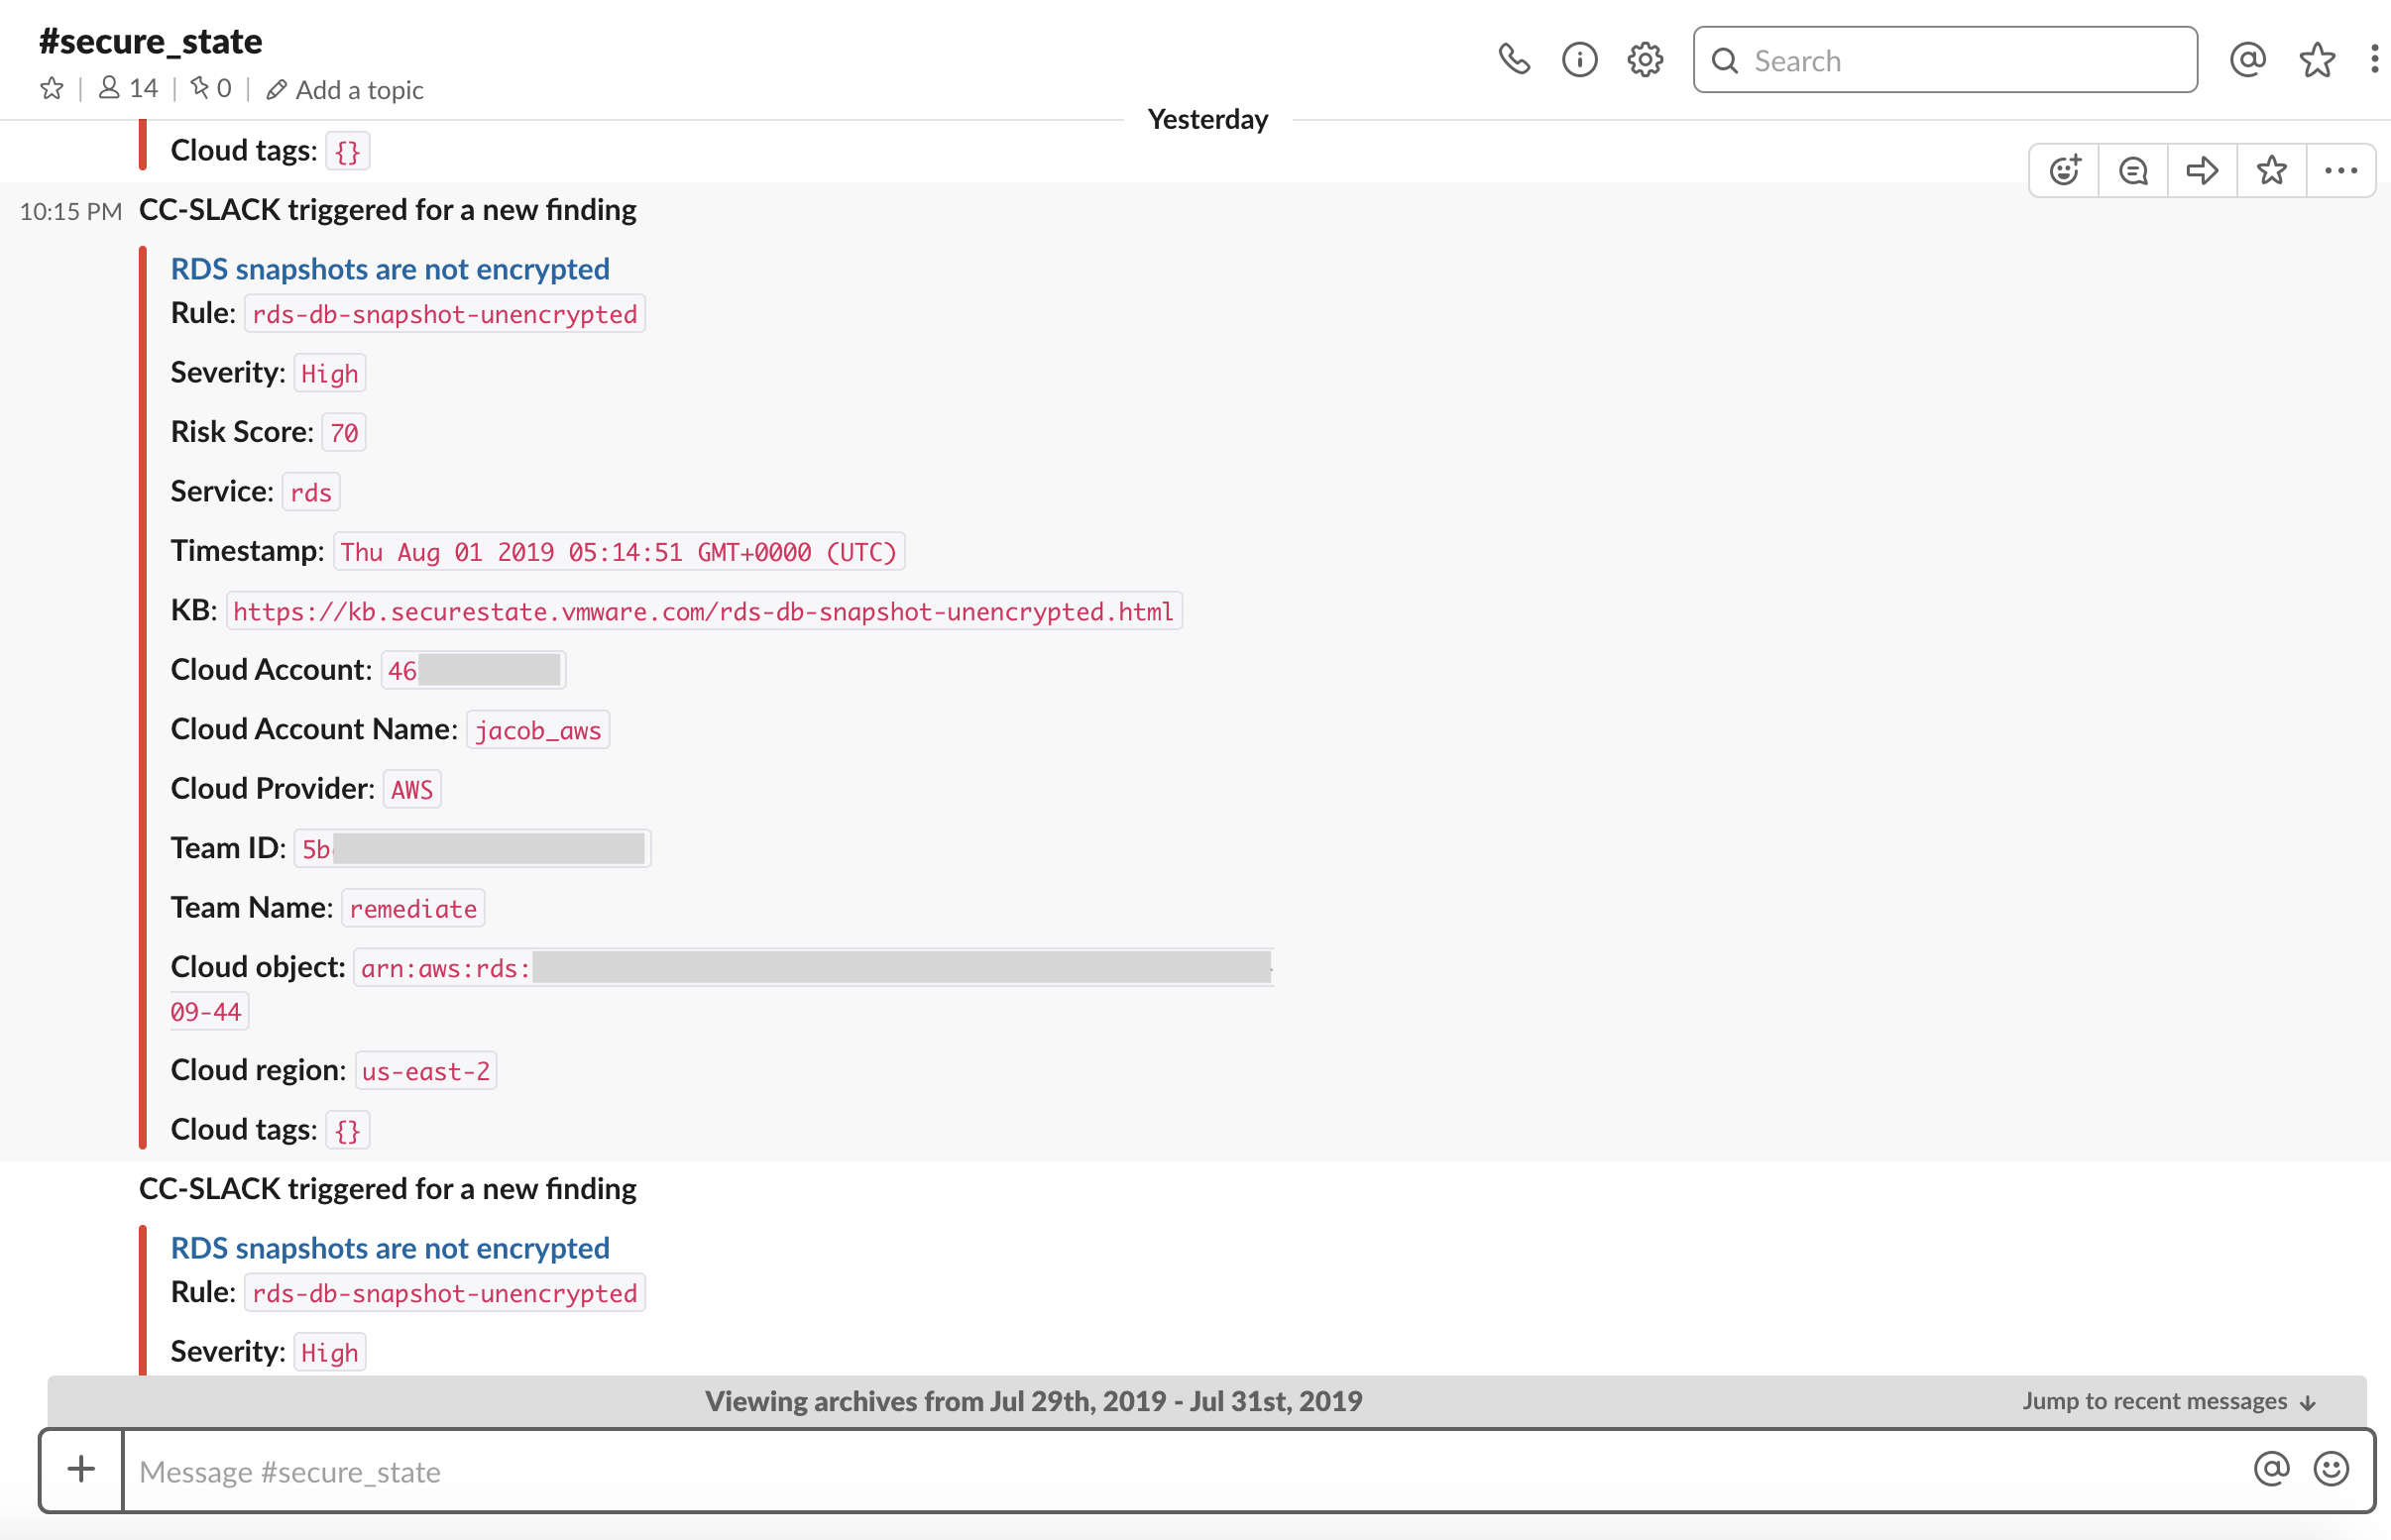
You can configure Slack alerts for any vulnerabilities detected in your cloud setup by selecting the notification method as Slack. Alternatively, you can choose email as your method instead if you prefer email notifications. Rich filter criteria is available to the users to create alerts based on Severity, Rule Name, Cloud Accounts, and so on.

You will now receive Secure State alerts in the Slack channel selected. These alerts will allow you to take actions on vulnerabilities detected in your cloud infrastructure in real-time.
Create a custom dashboard
CloudHealth Secure State has a single default dashboard available when you first onboard cloud accounts, but you can add as many additional dashboards as you need.
-
Click the Select Dashboards drop-down menu, then select Manage dashboard.
-
On the next screen, select Add Dashboard.
-
Enter a name for your dashboard, and choose the context if available (organization, or a an individual project you have access to).
-
Select a template for your dashboard. Three template types are available:
- Overview - The default template option, provides a high-level snapshot of your cloud security posture with metrics on findings, onboarded cloud accounts, suppression, compliance, and other top features.
- Trends - A template that displays data visualization for several findings metrics over time. You can view findings data over weekly, monthly, and biannual intervals.
- Compliance - This template provides a breakdown of your total compliance to all native and any custom frameworks.
-
Click Add.
Save dashboard filters
Follow these directions to permanently save filters to a selected dashboard. This feature is currently in private beta, reach out to your CloudHealth Secure State representative if you're interested in participating.
-
Click the Select Dashboards drop-down menu, then select Manage dashboard.
-
On the next screen, select the checkbox next to the dashboard you want to edit, then click Edit Dashboard.
-
Apply the filters you want to use, then click Save. You can review the Findings Guide for a list of each filter choice.
You can use this feature to create multiple versions of a dashboard that you can easily switch between, such as separate overview dashboards filtered for specific cloud providers.
Generate reports for continuous monitoring
Overview
In any organization with distributed operations, we understand that it is important to periodically inventory critical information about your cloud configurations and share security insights with stakeholders like the Ops, SecOps, IT, and Dev teams. To enable this, Secure State provides the functionality to configure email reports that can be generated and shared on a daily, weekly, or monthly basis.
Configure reports
To generate periodic reports for a group of email addresses, go to the Reports section and select “Create Report”.

Use rich filter criteria to generate reports for a specific cloud account, cloud tags, and so on to be shared with a list of email addresses.

At the configured frequency, selected email addresses will receive a report with a csv output of violations, so that the stakeholders can take the appropriate remediation steps.
Summary
You’re now ready to leverage the power of Secure State’s intelligent multi-cloud security model to minimize security risk and proactively mitigate threats. As a quick recap, here’s what you’ve done so far:
- Successfully configured an account to be protected by Secure State.
- Utilized the dashboard to get a deeper understanding of vulnerabilities.
- Setup real-time monitoring through email or Slack.
- Scheduled weekly summary reports.
Next steps
To make full use of Secure State security insights and management capabilities, you can:
- Set up Splunk to integrate multiple data sources.
- Build customized reports and automation by using Secure States' Public APIs.
- Onboard more cloud accounts in your organization in bulk using the CLI.
- Read more in the Knowledge Base about the types of vulnerabilities Secure State can detect.